Sponsored ads:
Eliott Wave Principle
The Elliott Wave Principle is a form of technical analysis that some traders use to analyze financial market cycles and forecast market trends by identifying extremes in investor psychology, highs and lows in prices, and other collective factors. Ralph Nelson Elliott (1871–1948), a professional accountant, discovered the underlying social principles and developed the analytical tools in the 1930s. He proposed that market prices unfold in specific patterns, which practitioners today call Elliott waves, or simply waves. Elliott published his theory of market behavior in the book The Wave Principle in 1938,
summarized it in a series of articles in Financial World magazine in 1939, and covered it most comprehensively in his final major work, Nature’s Laws: The Secret of the Universe in 1946. Elliott stated that “because man is subject to rhythmical procedure, calculations having to do with his activities can be projected far into the future with a justification and certainty heretofore unattainable.” The empirical validity of the Elliott Wave Principle remains the subject of debate.Stock chart trading basic tools – Lesson 2 – Trading according to stock Trend Line
 Fibonacci Retracement
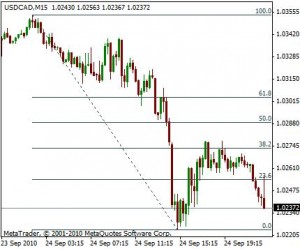
In finance, Fibonacci retracements is a method of technical analysis for determining support and resistance levels. They are named after their use of the Fibonacci sequence. Fibonacci retracement is based on the idea that markets will retrace a predictable portion of a move, after which they will continue to move in the original direction.
Sponsored ads:
Fibonacci retracement is created by taking two extreme points on a chart and dividing the vertical distance by the key Fibonacci ratios. 0.0% is considered to be the start of the retracement, while 100.0% is a complete reversal to the original part of the move. Once these levels are identified, horizontal lines are drawn and used to identify possible support and resistance levels.
Next, Lesson 4 – stock chart trading using Head and Shoulders pattern
Sponsored ads:
